| SOFTWARE |

When evaluating the biodegradation of chlorinated solvents, it is important to evaluate concentration trends for the parent species which are degrading, and also for the daughter products which are produced along the flow path. Radial diagrams provide a simple framework for illustrating concentration trends for both the parent species and daughter products on the same figure. This makes it easier to review the inter-related trends than comparing multiple contour figures.
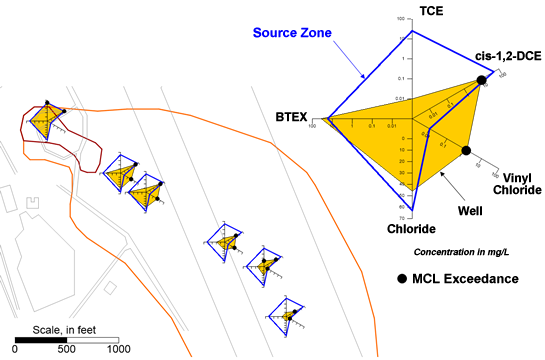
Figure 1 shows an example of a VOC radial diagram for the Plattsburgh Air Force Base, New York (Carey et al., 2003). The radial diagram inset shown on Figure 1 presents a VOC radial diagram for one monitoring well which is situated downgradient of the NAPL source zone. A reference data series (blue line) is plotted on the radial diagram inset, to represent source zone concentrations. The other data series (black line with orange fill) represents concentrations for the downgradient monitoring well represented by this radial diagram. The axes for the radial diagrams include total BTEX as an indicator of substrate concentrations, TCE, cis-1,2-DCE and vinyl chloride (which are daughter products of TCE reductive dechlorination), and chloride as a general indicator of biodegradation and groundwater flow path.
The radial diagram axes for VOCs on Figure 1 are plotted using a log scale, to facilitate an order-of-magnitude analysis with respect to relative changes in concentrations along the flow path, as well as a qualitative illustration of the relative ratio between parent and daughter product concentrations at each monitoring well. For example, trends which are clearly evident on the radial diagram shown on Figure 1 include:
- Total BTEX concentrations between the source zone and downgradient monitoring well in the inset radial diagram haven’t declined significantly – less than half an order-of-magnitude;
- TCE concentrations over the same distance have declined by more than 3 orders-of-magnitude, indicating that substantial TCE biodegradation has occurred between these wells;
- Cis-1,2-DCE concentrations have declined by about half an order-of-magnitude;
- Vinyl chloride concentrations have increased by more than two orders of magnitude, which indicates that significant reductive dichlorination of cis-1,2-DCE has occurred between these two wells; and
- Inorganic chloride concentrations are relatively similar at these two wells, with some decline observed as expected due to dispersion.
The above analysis demonstrates how this single radial diagram is useful for visualizing trends for these compounds over distance, as well as for visualizing relative parent and daughter product concentrations at each of these two wells.
Figure 1 also shows radial diagrams for all six primary monitoring wells overlaid on the site map. These radial diagrams further support the occurrence of naturally-occurring biodegradation of total BTEX, TCE, cis-1,2-DCE and vinyl chloride in groundwater at the Site. Figure 1 also demonstrates the use of symbols with Visual Bio to represent two types of options: (1) non-detect concentrations; and/or (2) detected concentrations which exceed cleanup criteria such as MCLs. For example, Figure 1 shows that TCE and cis-1,2-DCE exceed MCLs in the source zone whereas vinyl chloride does not; and that downgradient wells typically have exceedances of cis-1,2-DCE and vinyl chloride, but not TCE.